
In the previous blog post, you could learn about the large societal cost of plastic waste, its devastating impact on the marine ecosystem, and single-use packaging as one of the main drivers of the plastic pandemic. As promised, this post is dedicated to giving a more in-depth view on certain industries and their contribution to the plastic problem, showcasing RGS’s results on this matter for the first time publicly.
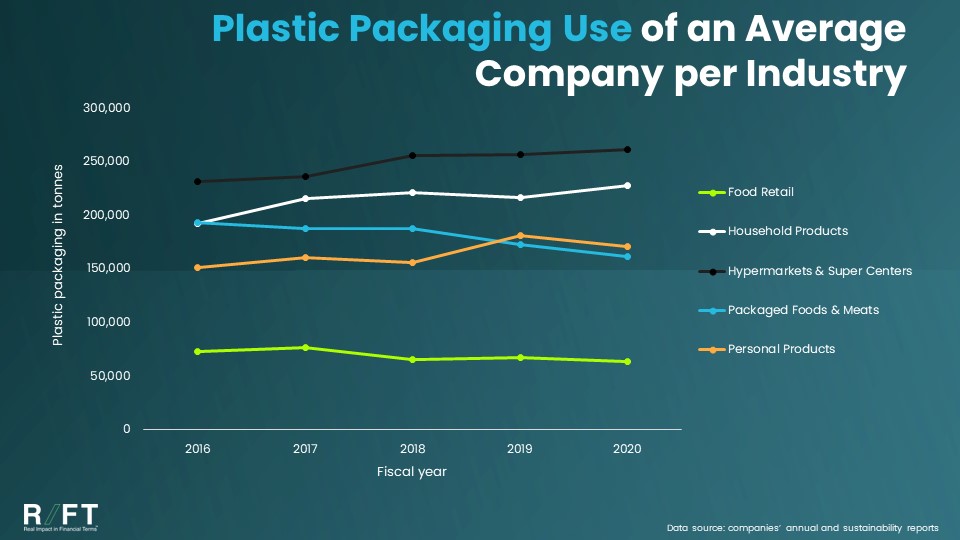
Focusing on the largest cap companies of the world, within the S&P Global 1200 Index, our industry-level results reveal that the largest plastic packaging user industries are - no surprise - Hypermarkets & Super Centers, Household Products, Personal Products, Packaged Foods & Meats (PFM), and Food Retail.
How does an average company in each of these industries compare in their plastic packaging use? Sadly, the majority of these industries have actually increased their plastic packaging consumption in tonnes on average by 15% between 2016 and 2020 - except for Food Retail and PFM where an average company managed to perform a gradual, 13% and 16% decline respectively in the use of plastic as packaging for their products.
Wait a minute - in which industry does Coca-Cola and the like fall into then?
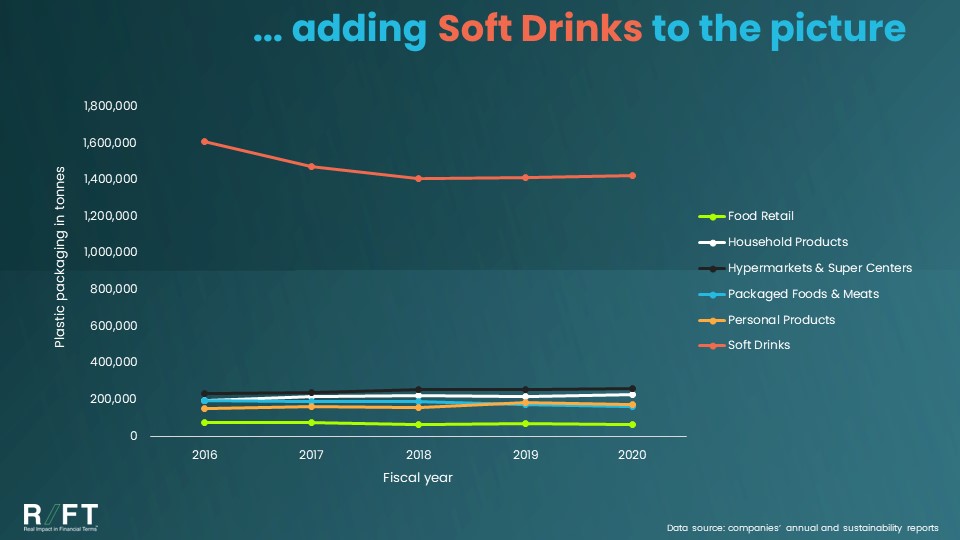
Spot on - the Soft Drinks industry is deliberately missing from the previous chart. Adding it to the rest of the industries, the outlook drastically changes though.
An average company in the Soft Drinks industry emitted approximately 1.4 million tonnes of plastic packaging to the world in 2020 which is 1.6 times more than the sum of other industries’ average companies. Even if there was on average a 13 percentage point decline of Soft Drinks producers’ plastic usage from 2016 to 2020, unfortunately a slight, 0.6% year-on-year increase can be observed from 2018 onwards. Our findings are in line with those in beach clean-up reports that claim that beverages bottles are the most common plastic packaging waste type found in our environment [1].
What is the best metric to benchmark industries’ real performance?
It is not enough to look at the volume of plastic packaging only of course. What we might be interested in is rather the industries’ relative performance - meaning whether any of these industries could on average reduce their plastic packaging intensity (that is their plastic packaging in tonnes divided by their revenues). Such a metric can better indicate the real performance of industries, definitely more so when compared to each other and over time.
For example, if an industry grows both its revenues and plastic packaging emission but the latter by a smaller extent from one year to the other, then the plastic intensity falls and the industry is deemed to perform better as it requires relatively less plastic packaging to generate more revenues.
Let’s have a look how our previous examples demonstrate this:
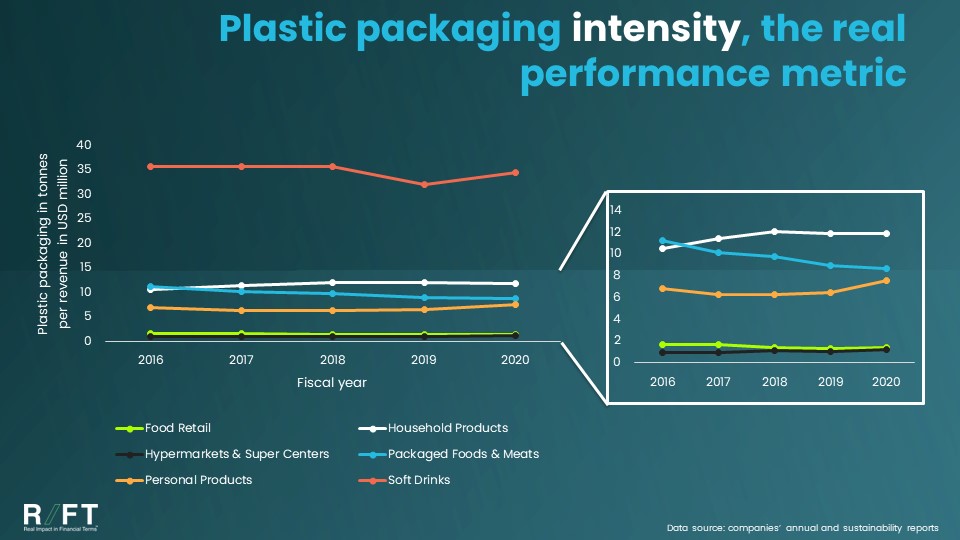
As our results show, the Soft Drinks industry is a laggard from both absolute and relative performance perspectives, and it has no significant relative improvement over time. Interestingly, however, an average company in the Hypermarkets & Super Centers industry is the second worst performing when we look at absolute performance (chart 1) while the best performing one in relative performance with the lowest plastic packaging intensity. Household and Personal Products both increased their plastic intensity by c. 12% over time, while PFM is a champion in reducing its intensity by 22% from 2016 and 2020.
All in all, it seems that irrespective of companies’ plastic related initiatives and targets, there have not been any significant improvements yet in successfully reducing plastic packaging volume or intensity over time, except for the PFM industry. Even though companies might have been focusing on replacing virgin plastic with recycled plastic content, this initiative does not solve the devastating end-of-life impact of plastics.
If the above quick preview raised your interest and would like to get further insights to understand in which industries plastic pollution is the most pressing issue, how industries performance changed over time, which companies are the best and worst performers, how do companies reduce or increase their plastic packaging intensity over time - reach out to us to get more information.
[1] Ocean Conservancy, We Clean On, 2021 Cleanup Report, (2021) available at https://oceanconservancy.org/wp-content/uploads/2021/09/2020-ICC-Report_Web_FINAL-0909.pdf
Chart sources: Data collected from companies’ annual and sustainability reports.
Photo by Marc Newberry on Unsplash

